The Easy Progress – Hill Chart for Jira gadget brings your hill charts directly to Jira dashboards. Use it to track progress on key issues (Initiatives, Epics, or Tasks) and their child issues - all in one visual snapshot 📊 .
➤ Add the Gadget to Your Dashboard
-
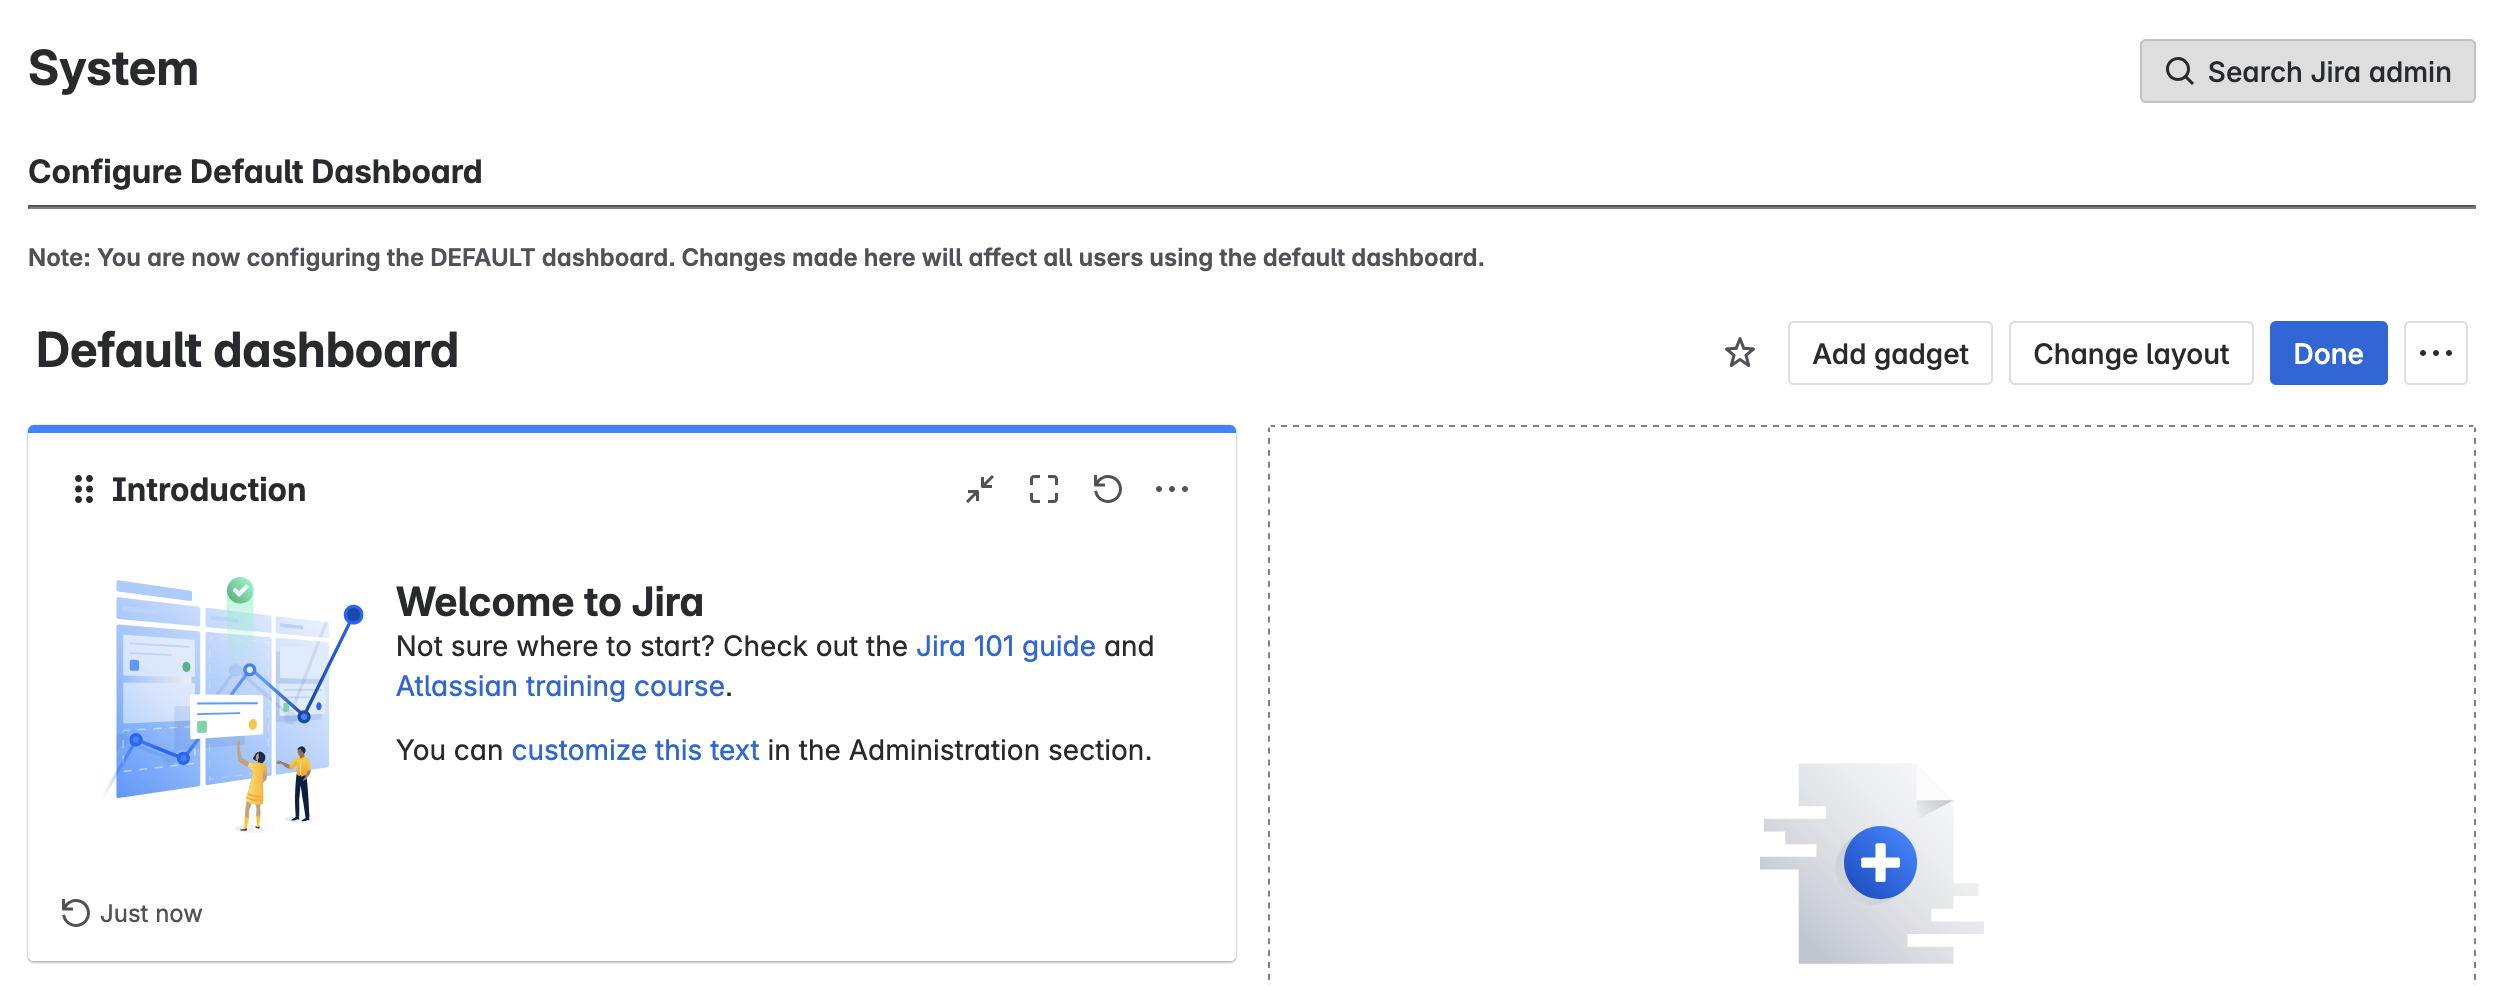
Go to your Jira Dashboard.
-
Click “Edit”
-
Click “Add gadget”.
-
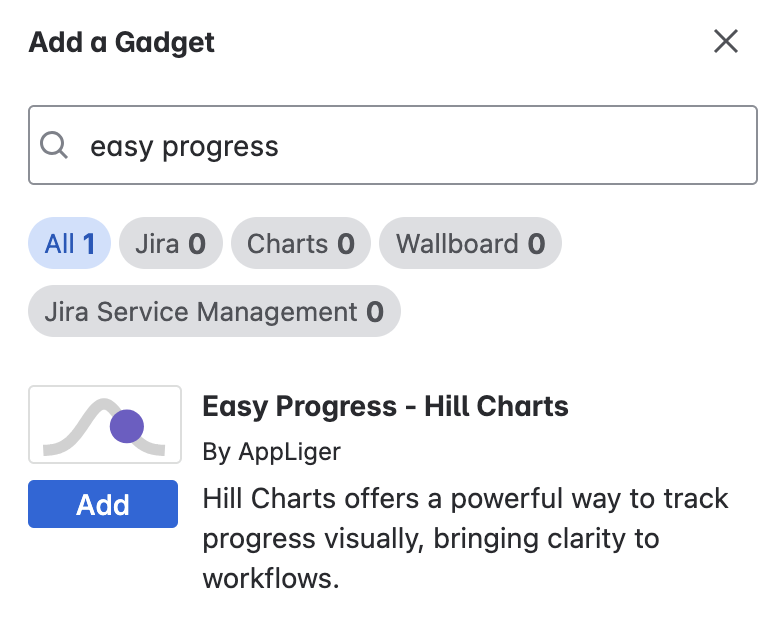
Search for “Easy Progress”.
-
Click “Add”, then Close the gadget browser.
➤ Configure the Gadget
-
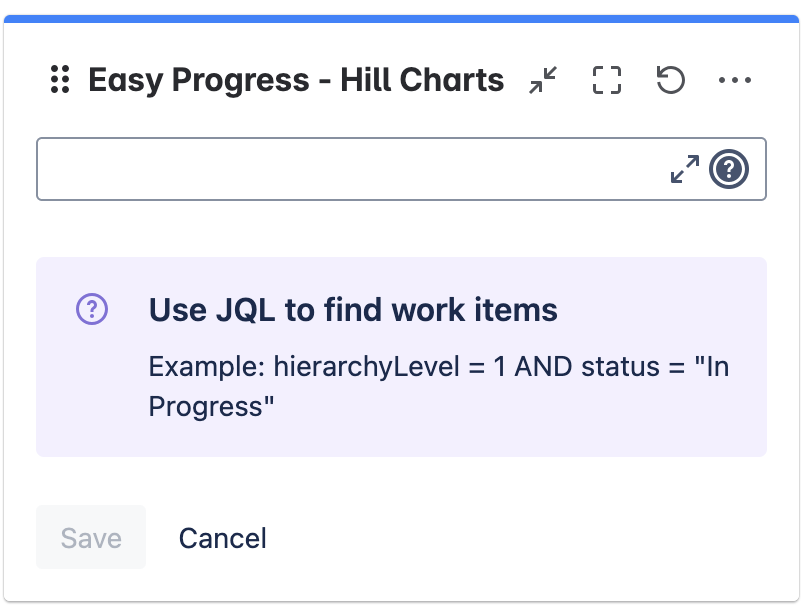
Click “Configure” on the gadget.
-
In the JQL query field, enter a Jira Query Language (JQL) statement that returns parent issues (e.g., Initiatives, Epics, or Tasks).
Example:SQLproject = Development AND issuetype = Initiative AND statusCategory != Done -
Click “Save”.
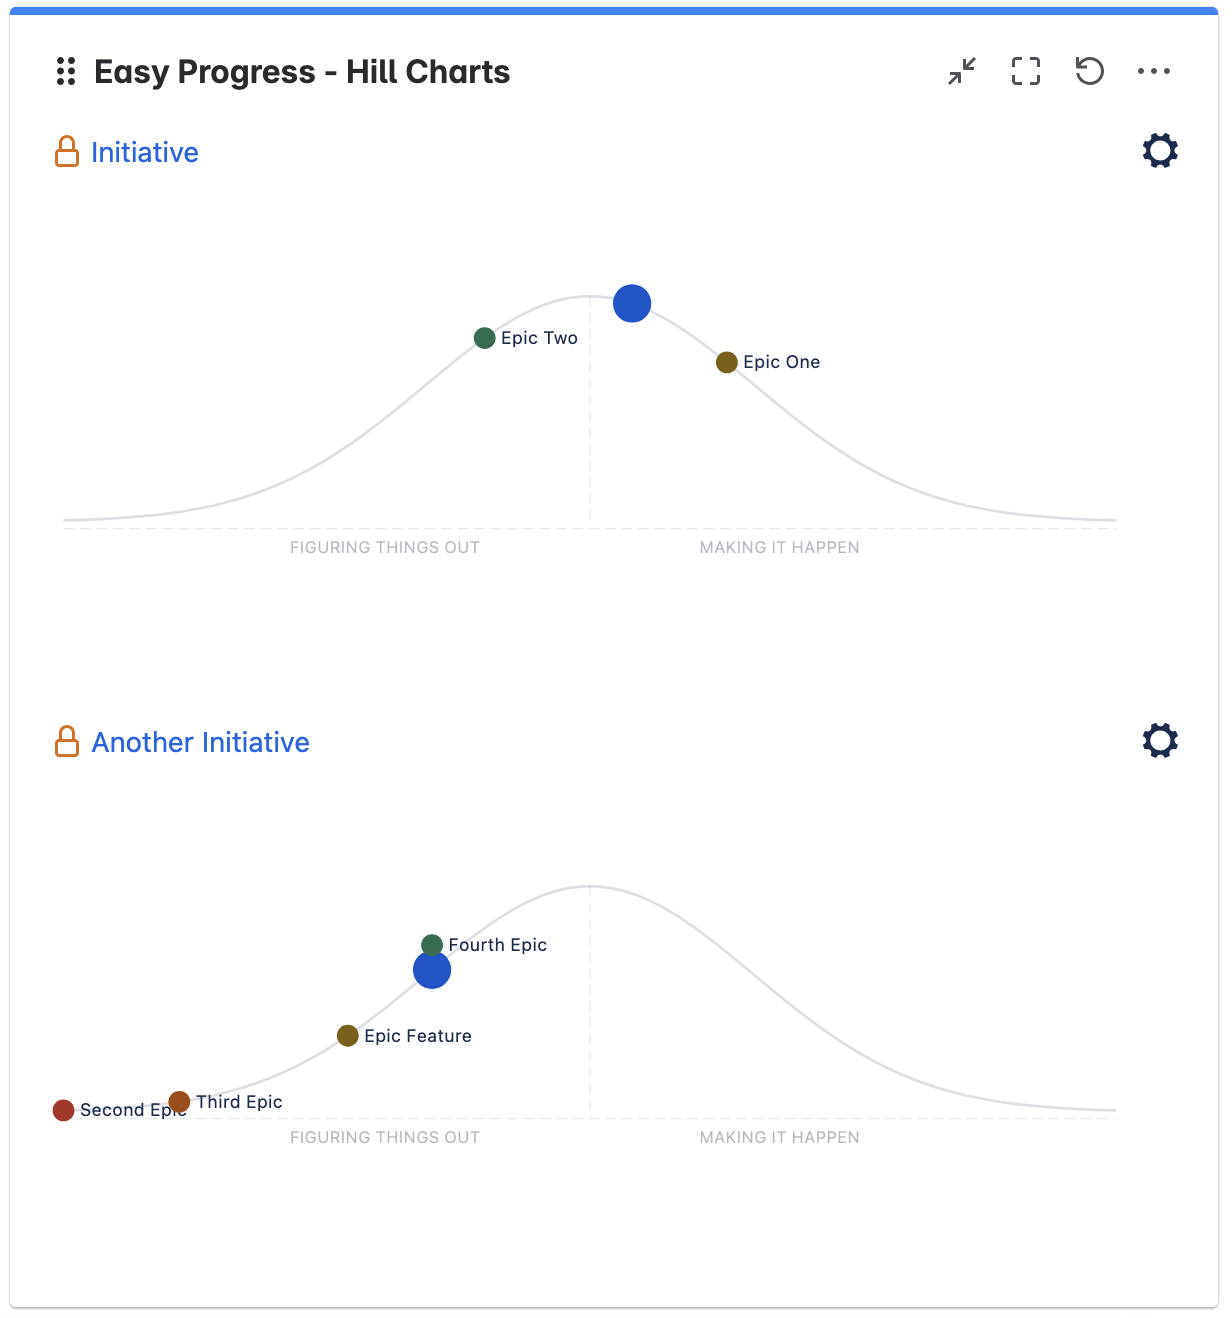
The gadget will render a hill chart for each issue returned by your JQL. Each chart includes its child issues automatically.
-
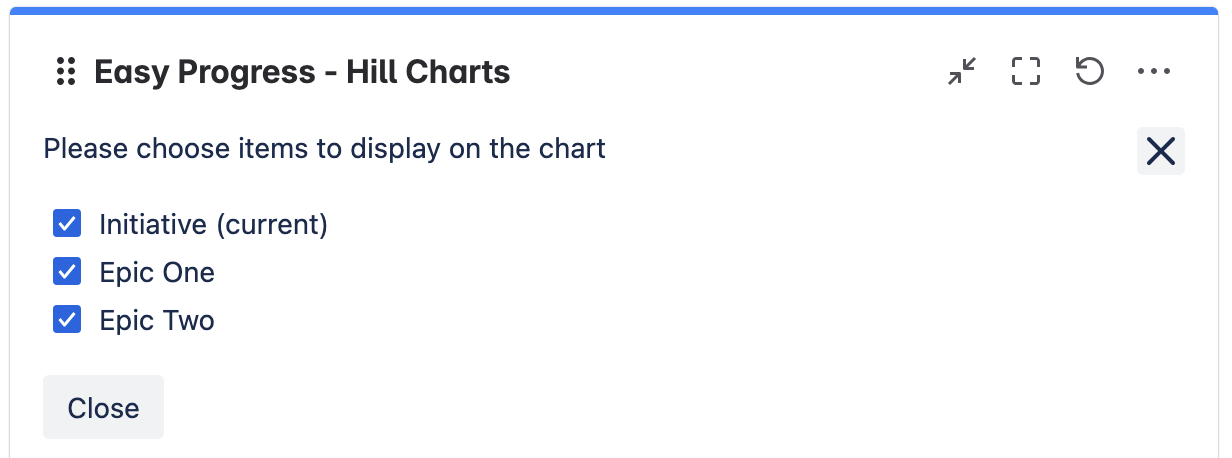
You may control which items to show on the chart by clicking the “Cog” icon ⚙️, just like in the initial setup of your Hill Chart Issue View. Settings are saved per issue and synchronized with Issue View.
✅ What You’ll See
-
One or more hill charts, depending on your JQL results.
-
Each chart corresponds to the progress of parent and child issues, showing:
-
The issue type
-
The issue summary
-
A clickable link to open the full issue in Jira
-
-
Child issues appear as draggable points on the hill chart:
-
Drag the dots to update their progress position.
-
Add a comment to explain the progress change (optional).
-
-
To view full details and history:
-
Click the parent issue link above the chart.
-
Open the issue in Jira to see child issues and progress comments.
-
Enjoy improved clarity and visibility across various Hill Charts on your Jira Dashboard with your team using the Easy Progress gadget! 🎉
Need Help?
Reach out via the Customer Portal for assistance 🛟

