
Purpose of HAR Files
A HAR (HTTP Archive) file logs a browser's interaction with a site. HAR files are useful for troubleshooting issues like:
-
Performance Problems: Slow page load or timeouts.
-
Page Rendering Issues: Incorrect formatting or missing information.
These logs provide insight for first-line troubleshooting, allowing support teams to diagnose and resolve issues more efficiently.
See how HAR files are generated depending on your browser variant.
Solution
1. Google Chrome
-
Open Google Chrome and go to the page where the issue is occurring.
-
Right-click anywhere on the page and select Inspect or press
F12(Windows) orCmd + Option + I(Mac) to open Developer Tools. -
Navigate to the Network tab in DevTools.
-
Make sure the Preserve log checkbox is selected.
-
Reload the page to capture the activity.
-
Perform the steps that trigger the issue.
-
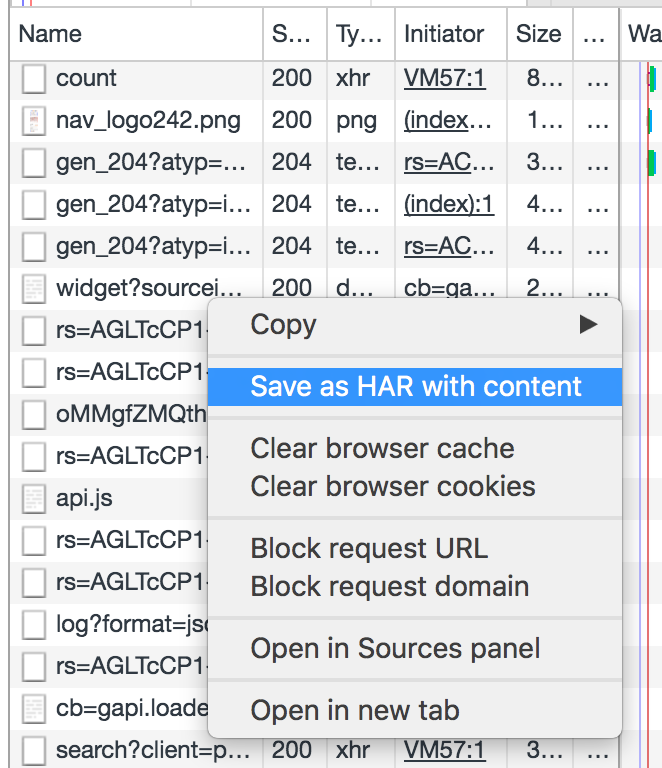
After reproducing the issue, right-click anywhere in the Network panel, select Save all as HAR with content, and save the file.
-
Save the HAR file.
2. Mozilla Firefox
-
Open Firefox and go to the page where the issue is occurring.
-
Right-click anywhere on the page and select Inspect or press
Ctrl + Shift + E(Windows) orCmd + Option + E(Mac) to open Developer Tools. -
Click on the Network tab.
-
Click the gear icon (settings) and make sure the Persist logs checkbox is selected to retain the logs.
-
Reload the page to capture the traffic.
-
Reproduce the issue.
-
After reproducing the issue, right-click anywhere in the Network panel, select Save All As HAR with content, and save the file.
3. Microsoft Edge
-
Launch Microsoft Edge and go to the page where you are experiencing the issue.
-
Right-click and choose Inspect or press
F12(Windows) orCmd + Option + I(Mac) to open Developer Tools. -
Switch to the Network tab.
-
Ensure that the Preserve log option is checked.
-
Once the problem has occurred, click on Save (floppy disk icon) to export the HAR file. Export as HAR.
4. Safari
-
In Safari, enable the Develop menu by going to Safari > Preferences > Advanced and checking Show Develop menu in the menu bar.
-
Load the page where the issue occurs.
-
In the menu bar, click on Develop and then Show Web Inspector.
-
Go to the Network tab.
-
Reload the page to start recording the network activity.
-
Reproduce the issue.
-
Click on Export (the button is near the Disable Caches checkbox).
5. Internet Explorer
-
A note, Microsoft's Using Windows Internet Explorer Developer Tools Network Capture KB can be used to identify how to diagnose network issues. For further info on HTTP codes, please look through HTTP/1.1 Status Codes .
-
If you are IE 11, please follow the steps covered in Analyzing your webpage's network traffic , and use Export captured traffic.
More details on Atlassian Knowledge Base
For any questions or feature requests, contact us via Customer Portal